|
|
Post by pling on Nov 14, 2015 13:21:49 GMT
Solenergi dekker i dag kun én prosent av verdens totale energibehov. I 2010 utgjorde PV og CSP tilsammen kun 0,062% av verdens energiforbruk.  Figur: WikipediaDe siste årene har utbyggingen av solenergisystemer derimot vokst formidabelt. Ved utgangen av 2011 var det installert 71,1 GW solenergisystemer tilsvarende en 85 TWh pr. år. I 2013 dekket solenergisystemene 142 GW og allerede ved utgangen av 2014 var denne andelen økt til ca. 178 GW, noe som tilsvarer ca. 1% av verdens energibehov på 18400 TWh. Afrika har 15% av verdens befolkning og bruker i dag ca. 3 % av den globale elektrisiteten. Fra artikkelen " Solar power to light the way for Africa as low-carbon campaign launches", the guardian.com 22. oktober 2015: - A dramatic fall in the cost of solar power, combined with growing access to mobile phones, has given Africa the chance to leapfrog richer countries’ polluting energy sources and to kickstart business, said Annan, chairman of the Africa progress panel and former UN secretary general. - At present rates of progress, 300 million people in Africa will still lack electricity by 2040. This is intolerable, avoidable and profoundly unfair,” said Annan. - On Wednesday, Nigeria and Sierra Leone signed agreements with Britain to fast-track off-grid solar power to households. A further 12 countries, including Malawi, Senegal and Tanzania, are expected to join the Energy Africa alliance shortly. Polysilicon price of US$ 400/kg in 2008 × Assumed silicon utilization of 6.0 g/W in 2008 = Polysilicon price in the module US$ 2.40/W in 2008; Polysilicon price of US$ 23/kg in 2014 × Current silicon utilization of 5.3 g/W in 2014 [5] = Polysilicon price in the module $0.12/Watt in 2014. For hver nye prosentandel av det globale energibehovet solenergi skal dekke vil det trenges 0,95 millioner tonn polysilisium. Og basert på uttalelser om at dagens vekstrate ikke er høy nok, kan man anta å nå 2% før nye 5 år har gått? |
|
|
|
Post by pling on Nov 14, 2015 16:38:42 GMT
Forskjellige vekstscenarioer i perioden 2015-2020 (Kilde: Wikipedia) Forecasting company
or organization | Cumulative
by 2020 | To be added
2015–20207 | Ø Annual
installation | | IEA (baseline, 2014) | 403 GW | 225 GW | 38 GW | | GlobalData (2014) | 414 GW | 236 GW | 39 GW | | SPE/EPIA (low scenario, 2015)1 | 444 GW | 266 GW | 44 GW | | Frost & Sullivan (2015) | 446 GW | 268 GW | 45 GW
| | IEA (enhanced case, 2014)2 | 490 GW | 312 GW | 52 GW | | Grand View Research (2015) | 490 GW | 312 GW | 52 GW | | Citigroup (CitiResearch, 2013) | 500 GW | 322 GW | 54 GW | | PVMA (medium scenario, 2015)3 | 536 GW | 358 GW | 60 GW | | IHS (10.5% CAGR, 2015)4 | 566 GW | 388 GW | 65 GW | | BNEF (New Energy Outlook 2015)5 | 589 GW | 411 GW | 69 GW | | SPE/EPIA (high scenario, 2015)1 | 630 GW | 452 GW | 75 GW | | Fraunhofer (17% CAGR, 2015)6 | 668 GW | 490 GW | 82 GW | | GTM Research (June, 2015) | 696 GW | 518 GW | 86 GW |
1 SPE – extrapolated 2019-projection (396 GW and 540 GW, resp.) 2 IEA – arithmetic mean of 465–515 GW [15] 3 PVMA – average of scenarios (444–630 GW), read from diagram 4 IHS – extrapolated 2019-estimate, based on a CAGR of 10.5% 5 BNEF – figures may include contribution from CSP [24] 6 FSH – external expert scenario based on a CAGR of 17% 7 Difference to global cumulative as of the end of 2014 (178 GW) Planlagte installasjoner i 2015:- About 40 countries are expected to install more than 100 megawatts in 2015 (compared to 25 countries in 2014). In the United States, installations are predicted to grow by 7.9 GW (SEIA) to 9.4 GW, up by about 30–45% over the record-year of 2014. Both, the United Kingdom (2.9–3.5 GW) and Japan (9–10.4 GW) are being forecasted to set new records in 2015. After three years of decline, installations in Europe are expected to grow again to 9.4 GW, up 19% over 2014. The Chinese government set its own 2015 solar target to 17.8 GW, much higher than its original 2014 target it ultimately missed to achieve. India is expected to install more than 2 GW, a tripling over the previous year. A return of deployment in the gigawatt-scale is predicted for France, and record installations of 1.1 GW are expected for Thailand, while deployment in Australia and Germany would remain unchanged. Latin America is forecasted to install 2.2 GW in 2015, with a significant contribution from the Central American region for the first time, while Chile and Mexico are expected to double and triple their installations, respectively. The projected top five Latin American installers of 2015 are Chile (1 GW), Honduras (460 MW), Mexico (195 MW), Guatemala (98 MW) and Panama (62 MW). Rapid growth of solar PV is also expected to occur in Jordan, Pakistan and the Philippines. Basert på det laveste scenarioet (225 GW vekst), dvs. 1,25% økte markedsandeler, må det produseres 1,2 millioner tonn polysilisium. Slår det høyeste estimatet inn (518 GW vekst), dvs. 2,9% økte markedsandeler, må det produseres 2,75 millioner tonn polysilisium i perioden. Tar man snittet av høyeste (518 GW) og laveste (225 GW) får man 372 GW vekst over 5 år som gir ca. 75 GW utbygging pr. år. Dette gir et behov på 0,4 millioner tonn polysilisium pr. år. |
|
|
|
Post by pling on Nov 14, 2015 16:44:53 GMT
Den globale produksjonen av polysilisium domineres i dag av 5 store aktører hvor kinesiske GCL er største aktør med ca. 22% av verdensproduksjonen. i 2013 produserte GCL ca. 50 000 tonn, dvs. at den globale produksjonen var ca. 230 000 tonn. I 2015 og 2016 planlegges det med en økning på 150 000 tonn. (til 0,38 millioner tonn). Ifølge " Economic Measurements of Polysilicon for the Photovoltaic Industry: Market Competition and Manufacturing Competitiveness" fra mars 2015 var global produksjon 211 000 tonn i 2013. Produksjonen var fordelt på 4 forskjellige produksjonsprosesser: - Although there are a variety of polysilicon manufacturing technologies, the global production in 2013 was shared by four mainstream methods: Siemens HC (production 108 920 t), Siemens DC (production 79 000 t), FBR with silane (production 20 150 t), and Siemens with silane (production 3620 t).
|
|
|
|
Post by pling on Nov 15, 2015 14:38:35 GMT
PV Magazine har summert opp det viktigste fra en ny rapport publisert av GTM Research 14. oktober 2014: Polysilicon capacity expansions to pick up speed in 2015- Polysilicon 2015-2018: Supply, Demand, Cost and Pricing predicts that 70,000 metric tons of annual polysilicon production capacity will come online in 2015, and another 61,000 metric tons in 2016. - This will bring global polysilicon capacity to 437,000 metric tons, enough to support 85 GW of crystalline silicon PV module production. GTM Research estimates that at least 60 GW of PV demand will be needed to maintain supply/demand balance in 2016, and if demand is not great enough this could cause prices to crash. - However, through the end of 2015 GTM Research expects prices to remain stable at US$18-24 per kilogram. The global polysilicon market came out of its last period of oversupply in the second half of 2013, following a period of “severe” overcapacity from 2011 through 2013 which crashed prices and led to heavy losses at many companies. - Another finding of the report is that fluidized bed reactor (FBR) technology will make up a larger portion of polysilicon production. GTM Research predicts that FBR capacity will nearly double from 26,000 metric tons in 2014 to 46,000 metric tons in 2015, and increase again for the next two years. - However, despite this growth GTM Research expects FBR to represent only 15% of global polysilicon capacity in 2018.
|
|
|
|
Post by pling on Dec 9, 2015 18:21:58 GMT
Fra pv-magazine.com 15. august 2014China to close polysilicon import loophole from September
- As the U.S.-China trade war trundles on, China's Ministry of Commerce has said that it will seek to close a loophole that permits duty-free polysilicon from the U.S., EU and South Korea. - Prior to China's ruling on EU polysilicon imports, the U.S. and South Korea were hit with duties in January, rising as high as 57% for U.S. companies and applying for a period of five years. South Korean polysilicon providers were hit with tariffs of between 2.4% and 48.7% – a move that severely impacted trade in polysilicon between the two nations, dragging export volumes from South Korea to China down to $2.05 billion, which represented a 34% fall in trade from a year earlier. - A complete ban on imports, effectively blocking what China sees as the dumping of polysilicon, is expected to boost the supply of domestic polysilicon companies as China gears up for a strong second-half for its solar market. - The new policy on polysilicon imports will come into effect on September 1, confirmed China's Ministry of Commerce on its website. Fra pv-energytrend.com 23. september 2015REC Silicon Might Shut Down US Polysilicon Manufacturing Facility Due to Trade Disputes- REC Silicon ASA (REC Silicon) might shut down its polysilicon manufacturing plant in Moses Lake, Washington U.S.A. if China continued the 57% duty on the polysilicon imports. Approximately 400 of the current 720 employees would be laid off as long as the solar trade disputes over China and U.S.A. remain unresolved. "REC Silicon was brought into the solar trade war in retaliation for a dispute regarding imports of solar panels from China into the US.,” said Tore Torvund, REC Silicon's CEO. “Now there is a resolution deal on the table between the U.S. and China that would provide Chinese panel companies with valuable market access in the U.S. provided that at solution can be found also for US polysilicon. A global resolution of both the Chinese solar panels and U.S. polysilicon trade barriers provides enormous benefits for the whole of China's dynamic and rapidly growing PV industry.” - Given the fact that the spot prices of polysilicon in 2015 was not profitable enough, REC Silicon might wait and see if the quotations would be raised or dropped in 2016 for future decision. Yet REC Silicon has been reducing its production capacity gradually since the second quarter of 2015 due to the de facto solar trade barriers, while the layoff could be conducted step by step to meet the actual operation demand.
|
|
|
|
Post by pling on Dec 9, 2015 18:28:09 GMT
Fra sea.solar 20. november 2015Solar Trade War: CHINA VS EU- The European Commission intends to implement import tariffs as high as 67.9% on Chinese solar photovoltaic products, following in the footsteps of the U.S., which laid down tariffs of its own last year. - But as of press time, all three protagonists – China, the EU and the U.S. – were trying to find common ground on which to settle their differences without another series of tariffs falling on China. Following a complaint filed by Germany-based SolarWorld and members of EU ProSun, the EU launched a probe in September 2012 to determine if Chinese solar firms were dumping their products in the European sector at below-market prices. - Citing a copy it viewed of the commission’s plan, The Wall Street Journal reported that the duties will range between 37.3% and 67.9%, with bigger Chinese manufacturers likely getting hit the hardest. According to the commission document, well-known companies Suntech Power Holdings Co., LDK Solar Ltd. and Trina Solar Ltd. will see tariffs of 48.6%, 55.9% and 51.5%, respectively. - EU ProSun maintains that such anti-dumping duties will have a positive effect on Europe’s solar sector. “If the European Commission acts now against illegal dumping by Chinese solar manufacturers, this industry can survive and prosper,” said Milan Nitzschke, president of EU ProSun. “If the EU does not act, EU ProSun predicts a Chinese solar monopoly with disastrous consequences for European manufacturers, suppliers and customers.” - Chinese modules carried an average price of $0.66/W in March and were expected to increase to $0.67/W in June, based on a forecast from the IHS Solar Module Price Index. However, with EU commissioners planning to impose import duties, IHS says average pricing could surge to $0.97/W. - The EU and the U.S were working toward settlements with China that would eliminate the U.S. tariffs and prevent the EU’s measures, which were pegged to take effect on June 5.
|
|
|
|
Post by pling on Apr 11, 2016 22:43:03 GMT
Fra tu.no 11. april 2016Aldri har det blitt installert mer solkraft enn i fjor- Foreløpige tall fra Det internasjonale energibyrået (IEA) viser at det i fjor ble installert 25 prosent mer solkraft i verden enn året før. Mens det i 2014 ble bygget om lag 40 GW ny solkraftkapasitet, var dette tallet steget til hele 50 GW i 2015. - Vi forventer 20 prosent vekst i installasjonstakten, slik at man ser ca. 65 GW ny kapasitet på verdensbasis i år, sier Thorud til Teknisk Ukeblad. - Solkraftens bidrag til verdens kraftforsyning steg i fjor fra 1 prosent i 2014 til 1,3 prosent i 2015, ifølge rapporten. - Rapporten anslår at solkraftanleggene som var installert fram til januar 2016 vil produsere om lag 275 terawattimer (TWh) solkraft. 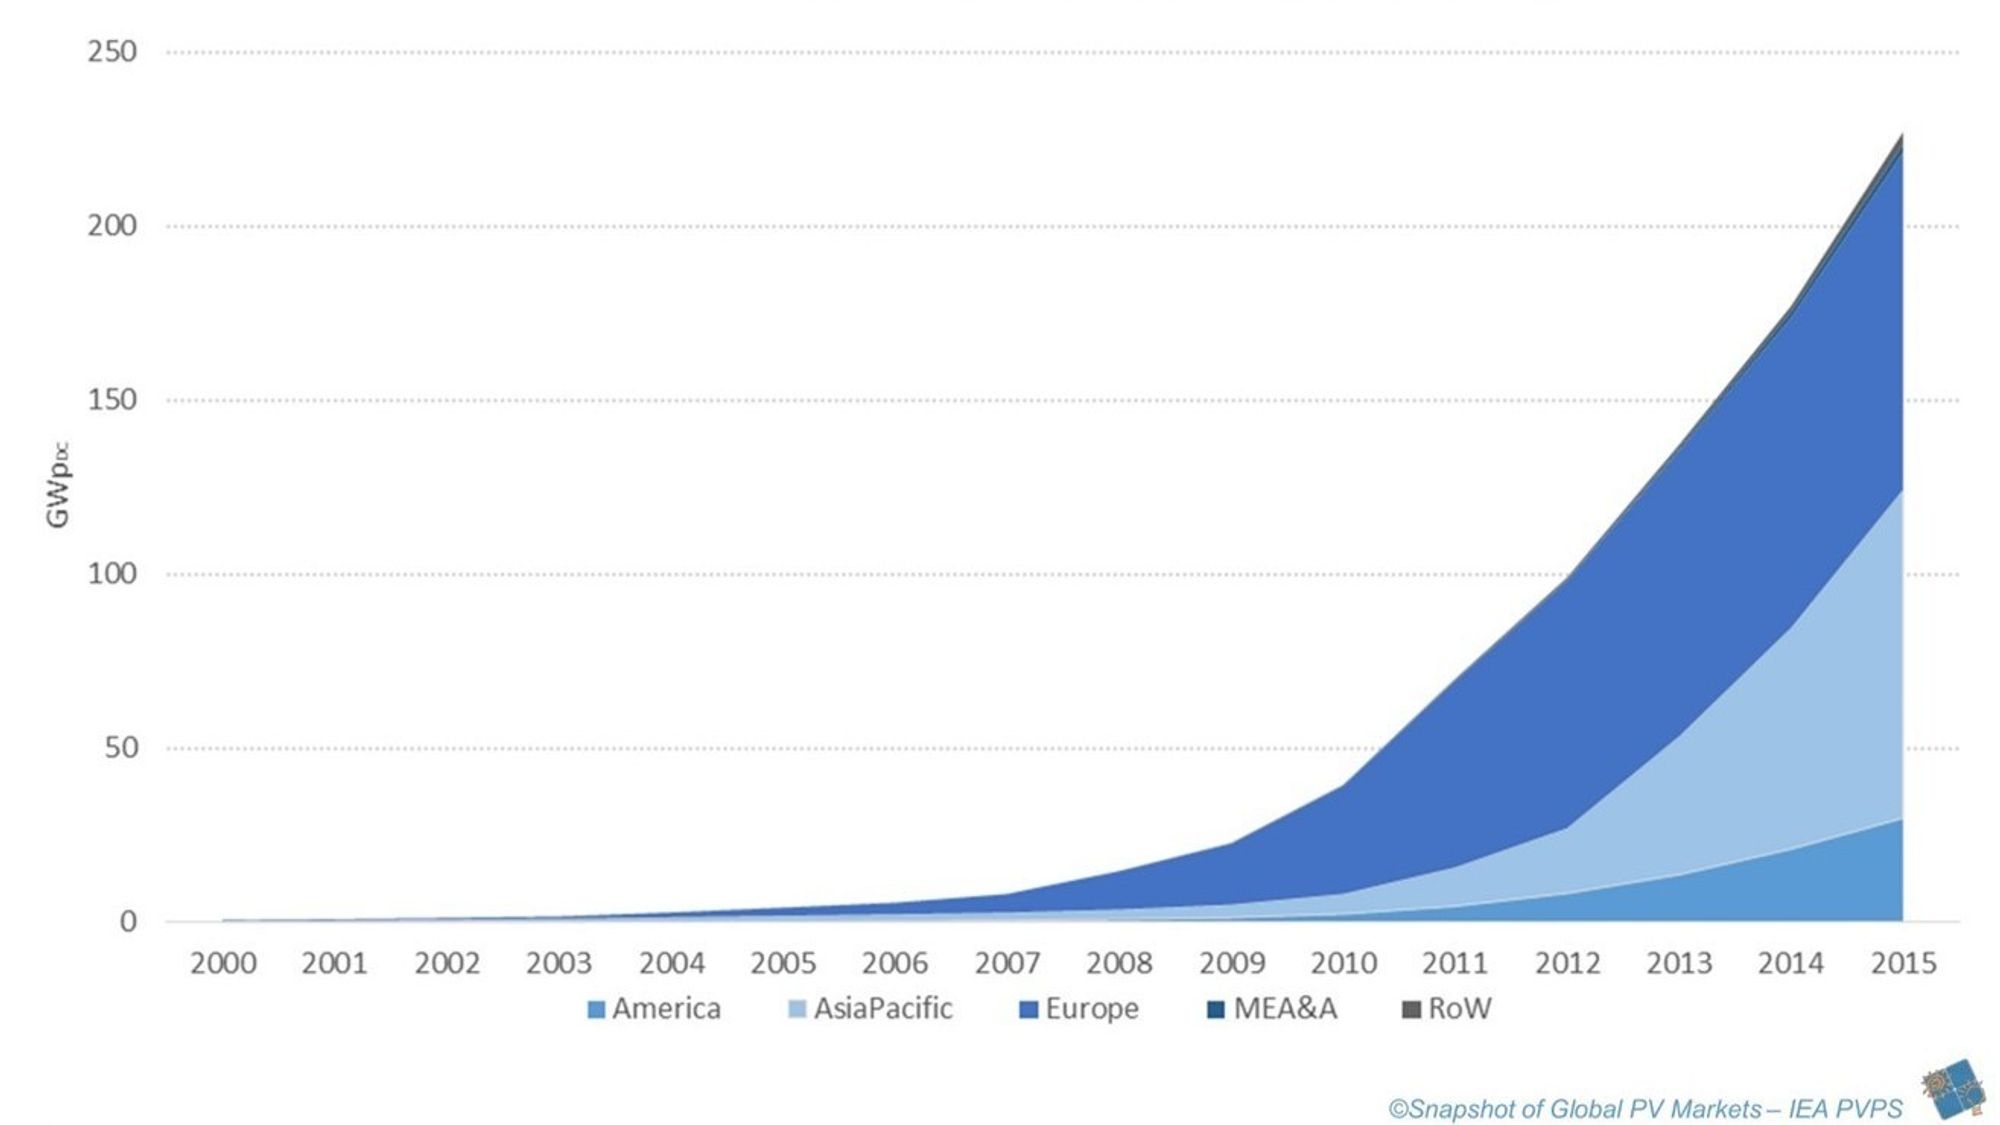
|
|


 Figur: Wikipedia